|
Komiya et al. (1999) demonstrated that within the accretionary complex
of the Early Archean ISB, basaltic lavas overlying hyaloclastite beds and
chert/BIF sediments were deposited in an open sea. Accretionary geology
enables us to estimate the tectonic setting of the Isua mafic volcanism.
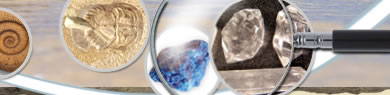
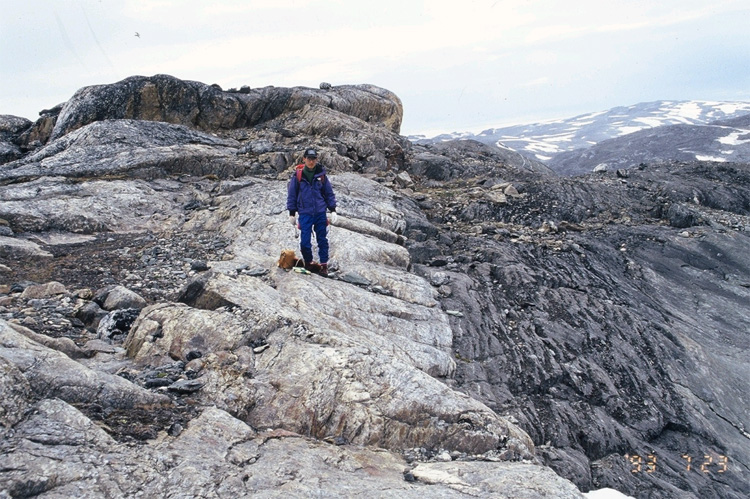
There are three distinctive mafic igneous suites in the ISB (Komiya et
al. 1999). The first consists of pillowed and massive lava flows with subordinate
amounts of related basaltic dykes and hyaloclastite layers that are overlain
by thick-bedded chert layers with no terrigenous material (Fig. 16ab).
This evidence indicates that the mafic rocks were formed remote from a
continental margin or island arc, and that the mafic volcanism preceded
deposition of the pelagic sediment, suggesting that the mafic volcanism
occurred at a mid-oceanic ridge (Isua MORB; Fig. 16). The second suite
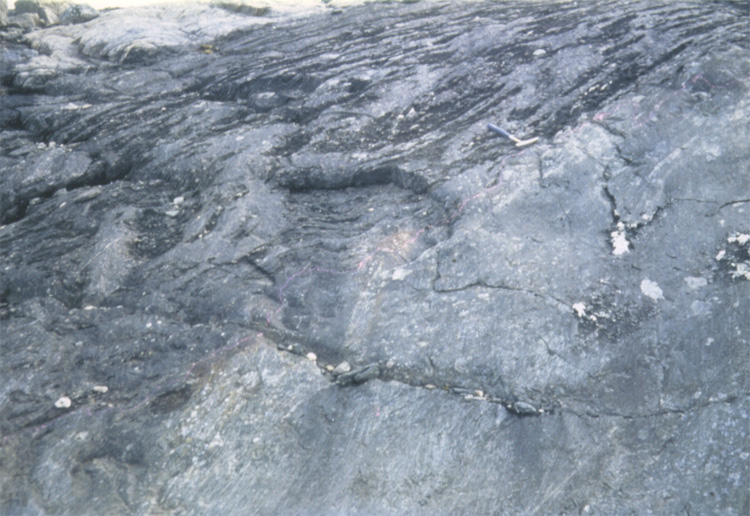
includes abundant doleritic dykes and sills that intrude pillowed lava
flows, lavas interlayered with chert, and bimodal felsic and mafic volcaniclastic
rocks in Duplex II, but they do not intrude clastic sediments (Fig. 17).
They were formed between an oceanic ridge and a subduction zone, suggesting
derivation from an oceanic island or oceanic plateau (Isua OIB). The third
suite includes abundant doleritic dykes, which intruded all of the above
units, including the clastic sediments; they may be related to post-accretionary
volcanism (Fig. 13). Isua OIB have lower Al2O3 and higher FeO*, TiO2, Y, Zr and Nb contents than Isua MORB at a given MgO content. Isua MORB
show LREE-depleted REE patterns, whereas Isua OIB have flat REE patterns
(Fig. 18, Komiya et al., 2004). The differences of field occurrence are
well correlated with the compositional differences, indicating mantle heterogeneities
in the Early Archean. Isua MORB have higher Al2O3 and lower TiO2, CaO, Na2O, Zr and Y contents than modern MORB at any given MgO content. They also
have higher FeO* at high MgO contents (>10 wt%). Major element chemistry
of Isua MORB indicates that the source mantle of Isua MORB had approximately
10 wt% FeO (Fig. 18). The higher content of FeO in the Early Archean mantle
suggests that upper mantle FeO content has decreased over time. The estimated
potential temperature of the source mantle of Isua MORB is approximately
1480 ℃, about 150 ℃ higher than the modern equivalent (Fig. 19).
|